Calories in pumpkin pie filling: 26 calories per 1 serving (85 g)
- 0.7 g protein
- 6.3 g carbs
- 0.2 g fat
- 2 g fiber
Source: USDA FoodData Central · 30 kcal per 100 g
A 1 serving (85 g) portion of pumpkin pie filling has 26 kcal in the USDA record used here, which is raw, dry pie pumpkin (peeled and seeded) rather than canned filling. Calories in pumpkin pie filling come mostly from carbohydrate, and the portion is low in fat and protein. Note that this record is for the raw squash itself, so it will not match the sugar, spices, eggs, and milk in a sweetened pie filling.
What stands out is the potassium: 401 mg in the lead serving, or 9% DV. The same serving also provides 8.6 mg of vitamin C (10% DV) and 2 g of fiber (7% DV). Water makes up most of the weight, at 77 g per 85 g.

Calories in Pumpkin Pie Filling by Serving Size
Calories in pumpkin pie filling for each common serving, with protein, carbs and fat:
| Serving | Calories | Protein | Carbs | Fat |
|---|---|---|---|---|
| 1 serving (85 g) | 26 | 0.7 g | 6.3 g | 0.2 g |
| 100 g | 30 | 0.9 g | 7.4 g | 0.2 g |
| 1 oz | 9 | 0.2 g | 2.1 g | 0.1 g |
Pumpkin Pie Filling Nutrition Facts
Calories in pumpkin pie filling and the full nutrition facts per 1 serving (85 g):
| Nutrient | Amount | % Daily Value* |
|---|---|---|
| Calories | 26 kcal | |
| Protein | 0.7 g | 1% |
| Total Fat | 0.2 g | 0% |
| Sodium | 0.3 mg | 0% |
| Total Carbohydrate | 6.3 g | 2% |
| Dietary Fiber | 2 g | 7% |
| Total Sugars | 3.5 g | |
| Calcium | 14 mg | 1% |
| Iron | 0.1 mg | 0% |
| Potassium | 401 mg | 9% |
| Magnesium | 11 mg | 3% |
| Zinc | 0.1 mg | 1% |
| Phosphorus | 19 mg | 2% |
| Vitamin C | 8.6 mg | 10% |
Where the calories come from: 85% carbs · 10% protein · 5% fat
*Percent Daily Values are based on a 2,000-calorie diet (FDA reference values). Source: USDA FoodData Central — Squash, pie pumpkin, peeled, seeded, raw (FDC ID 2727578, Foundation, published 4/24/2025). Values for other servings are calculated from the per-100 g data.
Why the Numbers Look So Low for Pumpkin Pie Filling
The data behind this page is a raw, dry pie pumpkin record, so it describes the squash before any cooking, sugar, or custard ingredients are added. Canned or prepared pumpkin pie filling is a different product, and its label should be used for the calories and sugar in a specific brand. The USDA record here shows that the squash base is low in calories and mostly water.
Per 100 g, the record lists 30 kcal, 7.4 g carbohydrate, 4.1 g total sugars, and 2.3 g fiber. Total fat is only 0.2 g per 100 g. Because most of the calories come from carbohydrate (85%), the base is very different from a rich, fat-heavy dessert.
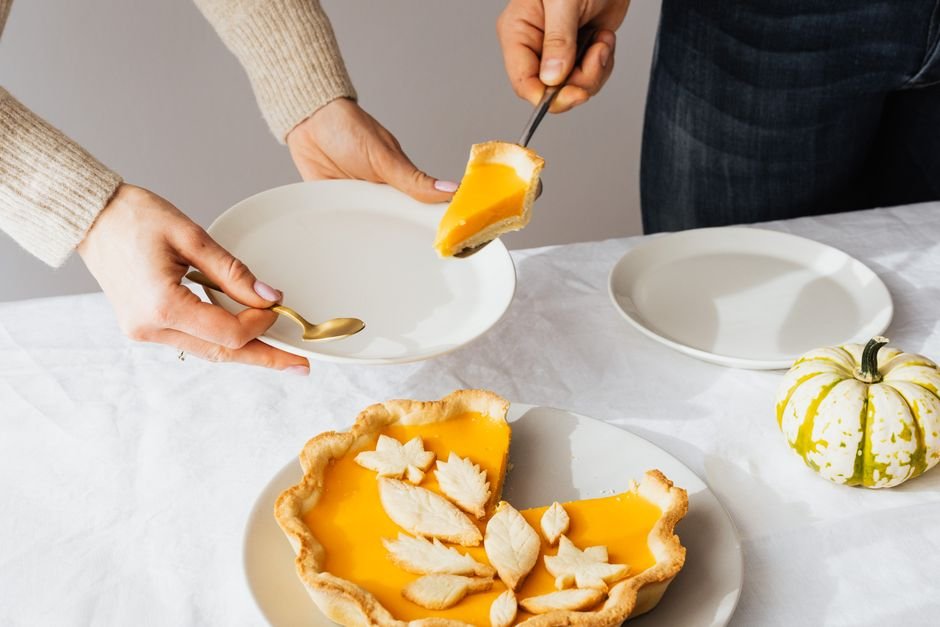
What Pumpkin Provides in a Serving
In the lead serving of 85 g, the record shows 401 mg of potassium, 2 g of fiber, and 8.6 mg of vitamin C. Magnesium is 11 mg (3% DV), and calcium is 14 mg (1% DV). These are small amounts for minerals, but they add up across a day of food.
- Potassium: 401 mg (9% DV)
- Fiber: 2 g (7% DV)
- Vitamin C: 8.6 mg (10% DV)
- Sodium: 0.3 mg (0% DV)
Sodium is negligible in this raw record. A sweetened, spiced pie filling with added salt may contain a different amount, so check the label of any packaged product.
Reading a Pie Filling Label Against This Data
If you are comparing a jar or can of pumpkin pie filling with this page, look at the serving size first. The 85 g serving here is a reference point for the squash, not a standard label serving. Pie fillings are often listed in different amounts, and added sugar, cream, eggs, and spices change the totals.
The best use of this data is to understand the base ingredient. Pumpkin itself contributes water, fiber, potassium, and vitamin C, while the added ingredients in a filling decide most of the sugar and fat.
How Pumpkin Pie Filling Compares
Per 100 g, next to similar foods in our database:
| Food (100 g) | Calories | Protein | Carbs | Fat |
|---|---|---|---|---|
| Pumpkin Pie Filling | 30 | 0.9 g | 7.4 g | 0.2 g |
| Cantaloupe Seeds | 38 | 0.8 g | 8.2 g | 0.2 g |
| Oyster Sauce | 51 | 1.4 g | 11 g | 0.3 g |
| Cola | 0 | 0 g | 1.1 g | 0 g |
| Hemp Hearts | 115 | 2.7 g | 26 g | 0.2 g |
| Plantain Chips Baked | 155 | 1.5 g | 41 g | 0.2 g |
Pumpkin Pie Filling FAQ
How many calories are in 100 g of pumpkin pie filling?
The USDA record used for this page lists 30 kcal per 100 g for raw, dry pie pumpkin, peeled and seeded. That is the squash itself, so a sweetened, prepared filling will usually have different numbers on its label.
Is pumpkin high in sugar?
In this record, total sugars are 4.1 g per 100 g and 3.5 g in the 85 g lead serving. Total carbohydrate is 7.4 g per 100 g, and most of the calories come from carbohydrate.
Does pumpkin have much fat or protein?
Not much. The record shows 0.2 g of total fat and 0.9 g of protein per 100 g, and 0.2 g of fat and 0.7 g of protein in the 85 g lead serving.
The Bottom Line
One 85 g serving of this raw pumpkin record has 26 kcal, mostly from carbohydrate, with 401 mg potassium and 2 g fiber. For a sweetened pie filling, check the product label, since sugar, cream, and eggs change the totals.